As we all know Social media is changing or influencing lot of the traditional communication mechanisms. Its providing more wide platform for people to share thoughts, advertise products and analyze user's feelings. For those close to technology, Social Media monitoring, Social Analytics, Social Engineering etc are buzzwords heard more often these days. Its hard for any body to ignore Social Media now. From my experience so far FMCG, Entertainment media are among the areas that has their presence more in Social Media. Its very common to see references to Twitter in print and electronic media these days.
Amir Khan's completed his Satyameva Jayate's (SMJ) first season. keeping aside the sensitiveness of topics, accuracy of facts, its impact on society etc, SMJ is certainly one of the shows which is talked about more in Social Media. Thought of using my experience in Social Analytics to present some of the analysis on SMJ from twitter feeds. I will start with basic analysis in this post.
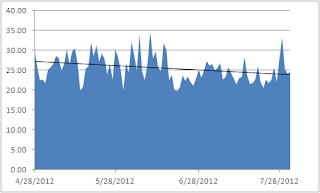
First lets see the tweet density, the number of related tweets during the 13 week time.  The peaks that you observe are, as expected, are on the days the show telecast.Overall trend line show little decline in tweet. Also few episodes in between are less popular. These are when topics like domestic voilance, use fertilizers etc discussed. Alcohol Abuse, Aging parents, Water conservation topics got some increased attention on twitter. Of course, this might reflect only immediate reaction to show. Will try to present detailed analysis by presenting average week analysis and topic wise analysis in future posts. Next lets see the Sentiment Analysis.
 The peaks that you observe are, as expected, are on the days the show telecast.Overall trend line show little decline in tweet. Also few episodes in between are less popular. These are when topics like domestic voilance, use fertilizers etc discussed. Alcohol Abuse, Aging parents, Water conservation topics got some increased attention on twitter. Of course, this might reflect only immediate reaction to show. Will try to present detailed analysis by presenting average week analysis and topic wise analysis in future posts. Next lets see the Sentiment Analysis.
Lets first look at the Positive trend, that is the percentage of the total tweets with positive sentiment over period of time. Adjacent graph depicts the positive sentiment. Overall trend line shows a little decline in positive sentiment. From initial observation it looks tweets during episode on medicine bear more positive sentiment compared to other episodes. Again, this graph reflects overall mood of the user in general. More deeper analysis, like feature based Sentiment Analysis, is required to capture exact mood of the audience. It will answer questions like, is this positive sentiment during healthcare episode is towards Amir's views or towards Health care industry?
 Finally lets look at Negative trend graph. Graph on left hand side shows the same. As observed the overall trend line shows increase in Negative trend. As mentioned earlier will provide deeper analysis in future posts. Main intention of this post is not to do postmortem of SMJ but to show some applications of Social Analytics with an interesting and relevant case study.
Before closing, a word about data collection and analysis techniques. Data was collected with Twitter Search API using keywords. Of the keywords used SMJ, Satyameva Jayate, Amir Khan, SatyamevJayate, smjindia are the common keywords used for all episodes and episode specific keywords like AlcoholAbuse, dignity4all etc based are used. I wont rule out possibility of missing some tweets partly because of timing of search and partly because of accuracy of Search API itself. I generally executed Search program couple of times on Sunday and once during week. For Sentiment Analysis used Sentistrength Algorithm (http://sentistrength.wlv.ac.uk/) with modified Lexicon. Again the accuracy of this Sentiment Analysis might not be high. I expect this to be around 65%. In fact from our experience so far this is reasonable accuracy especially for Social Media data which doesn't follow language grammar. For more information on Sentiment analysis of Twitter feeds look at this white paper I co-authored - http://t.co/aXAv7aly.

